In short
A NOC video wall puts network dashboards, cameras, tickets and incident views in one shared workspace. Start your NOC room design with the information operators need during an outage, then specify the sources, display layout and recovery checks. This reference architecture includes a worked source plan and a test procedure you can adapt to your own network operations centre.
NOC room design: sources, controller and display path
The signal path has three parts. Network dashboards and video feeds reach the controller over the network; a workstation or appliance with only a video output needs a compatible capture device. The controller renders those sources into a canvas and sends it through its GPU outputs to LCD panels or an LED processor. Operators use a separate browser console to change the layout.
| Layer | Example connection | Verify before ordering |
|---|---|---|
| Monitoring and tickets | Dashboard URL → controller browser source | Authentication, certificates, refresh and session expiry |
| Cameras | RTSP or NDI → network → controller | Codec, resolution, frame rate and access permissions |
| Workstation | RDP/VNC, or video output → Linux-compatible capture card | Input control where required; capture format and drivers |
| Display wall | NVIDIA GPU outputs → panels or LED processor | Total pixels, refresh rate, output count and panel mapping |
| Operator desk | Browser → controller console | Roles, concurrent use and access from the operations network |
Craft Wall runs on a Linux server with an NVIDIA GPU. Its source catalogue includes web pages, video streams, NDI, capture and remote desktops. A Grafana, Splunk or SolarWinds dashboard is a web-source integration to validate with the customer's authentication and network policy; a product name on a checklist does not establish a certified connector.
A worked NOC video wall layout
For an example source inventory, take four monitoring dashboards, two ticket or incident views, four camera streams and two remote desktops: twelve simultaneous sources. This is a planning example, not a measured server limit. Keep network health on the left, tickets and escalation in the centre, and cameras or maintenance desktops on the right.
Save a second scene for an incident. Enlarge the affected service dashboard and its ticket, keep the network overview visible, and retain a camera or maintenance desktop when it provides useful context. At shift handover, return to the standing-watch scene. Saved scenes and window control let you evaluate this workflow on the product stand.
For a 16-display wall, separately count the physical outputs needed by the selected panels. Loop-through panels and an LED processor change that calculation. Source count, output pixels, GPU decoding and rendering load all matter: use the sizing calculator to prepare a configuration, then validate the peak incident scene on the proposed hardware.
What the stand demonstrates
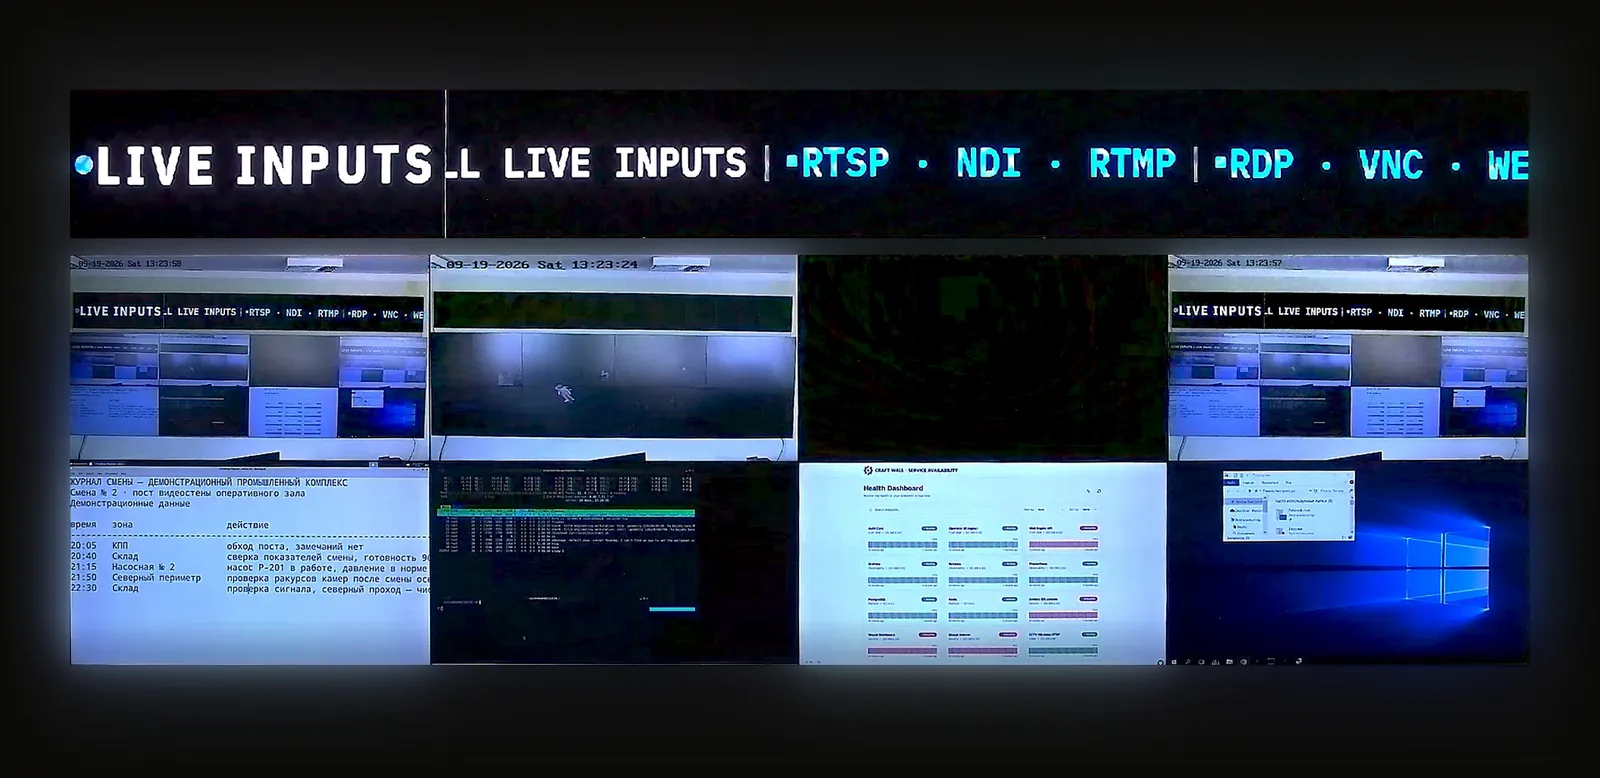
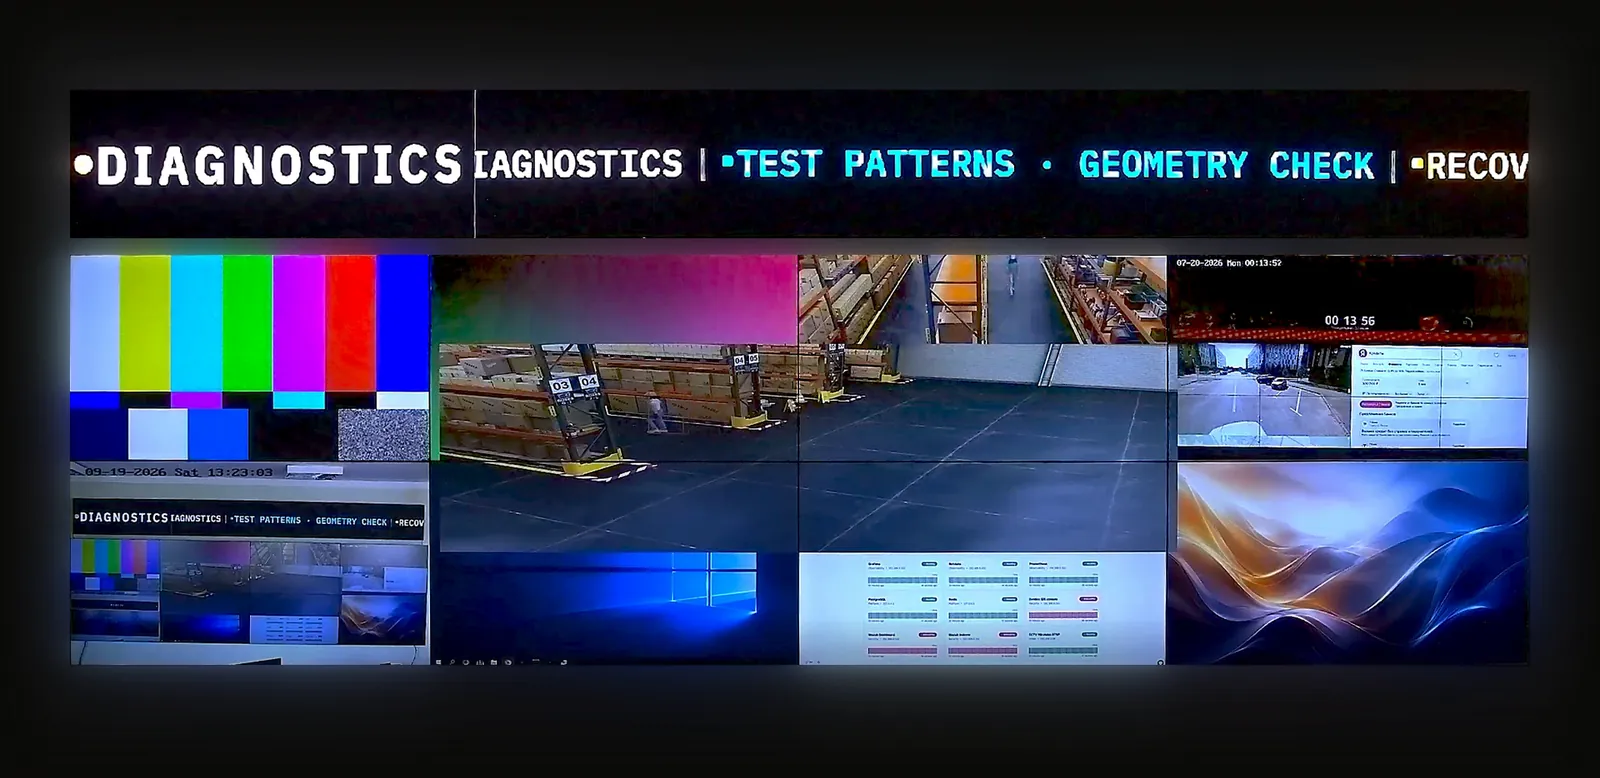
The source image on this page is a real capture of the Craft Wall stand with twelve source types, including cameras, NDI, capture, dashboards and remote desktops. Twelve types is not a claim about the maximum number of simultaneous streams. The stand also has a diagnostics scene for geometry checks and source recovery.
Acceptance checks for a 24/7 NOC
Record the server and GPU models, driver and software versions, display path, source formats and test duration before testing. Run these checks on a test source or in an agreed maintenance window; decide the acceptable recovery time with the operations team.
- Load the standing-watch and incident scenes. Read the smallest dashboard text from the actual operator position.
- Interrupt one test camera feed. Record what its window shows, whether other windows continue and how the source recovers after reconnection.
- Expire a test dashboard session. Check whether operators can recognise stale data and restore access without exposing personal credentials.
- Restart the controller in a planned test. Check scene restoration, authentication and the availability of each source.
- If a standby server is included, test the complete display path during switchover. Record interruption on the physical wall, not only the controller's status.
Craft Wall supervises sources separately, restores stored wall state and supports a hot-standby configuration. The reliability description explains the mechanisms; recovery time for your configuration belongs in the acceptance report. The recordings on this page do not establish an uptime percentage or a recovery-time guarantee.
Budget the complete NOC wall
The published Craft Wall software licence is €2,500 per server, perpetual, with no per-display, per-source or per-operator fee. Hardware capacity still limits the workload. For two controllers, list both servers and their licence requirements explicitly in the quote.
Price the displays, mounts, controller hardware, capture devices, network, commissioning and support separately. Compare those assumptions in the five-year TCO calculator; its output is a model, not a project offer. The pricing page separates software from the pre-configured server offer.
Try the operator workflow
Start with a session on the live stand to try source placement and scene changes. For your own authenticated dashboards, source mix or recovery targets, prepare a proof of concept with an agreed configuration and acceptance sheet.
For vendor selection, continue to the control-room software comparison. For security operations, see the SOC and SIEM guide.