In short
An energy dispatch video wall is not a larger SCADA monitor. It is the shared operational layer for supervisors, dispatchers, field coordinators, and incident managers who need to see grid state, alarms, maps, outage response, weather, CCTV, and work-order status together. The primary SCADA / EMS / DMS control chain remains on certified operator consoles.
What belongs on the wall in grid control
In a transmission or distribution control center, the wall should combine operational state with context. A useful source mix includes SCADA overview screens, EMS / DMS summaries, substation status, GIS maps, outage clusters, crew assignments, weather risk, and live CCTV from substations or field sites.
For a grid-control video wall, do not size the layout around one huge map. Keep a stable operating view and reserve space for escalation: emergency switching briefings, storm-response dashboards, public-update status, and executive summaries during a major event.
SCADA video wall: secondary visualization only
A SCADA video wall should show approved read-only summaries, not become the control system. Commands, switching, protection actions, and regulated operator procedures stay in the primary HMI and dispatch applications. The wall helps everyone in the room understand the same situation without expanding the certified control scope.
This is the same architectural boundary used in transport control rooms and restricted command centers: primary system first, shared wall second, audit and fallback around every source.
Pipelines, refineries, and industrial utilities
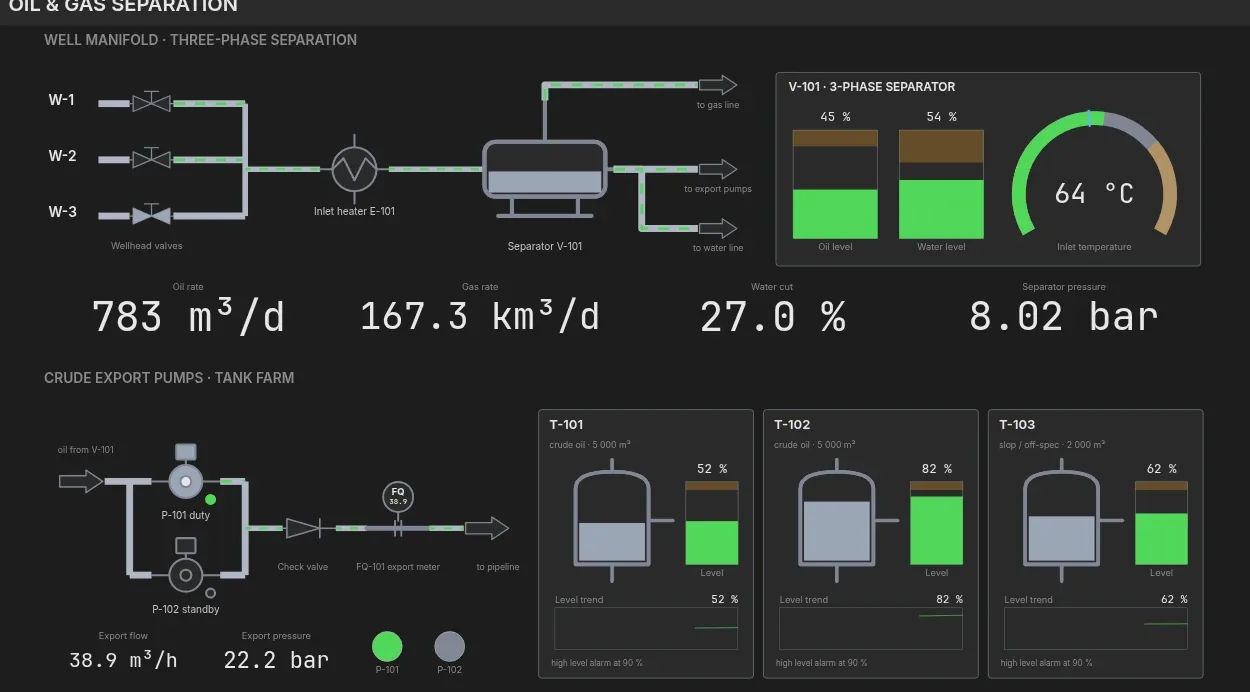
Pipeline dispatch, refinery operations, water utilities, and industrial plants have the same split. The wall can show SCADA summaries, CCTV, tank or pressure-zone status, pump stations, maintenance windows, safety notices, and incident boards. It should not become the place where operators execute process-control commands.
For restricted sites, pair the requirement with an air-gap-capable video wall architecture: local control, local rendering, named layouts, source health, and predictable degraded operation when an external network is unavailable.
Specification checklist
- Browser-rendered SCADA, EMS, DMS, GIS, BI, and work-order dashboards as first-class sources.
- RTSP / NDI / web-camera ingest for substations, plants, yards, and field sites.
- Named layouts for normal monitoring, outage, storm response, maintenance, training, and executive briefing.
- Source-health indicators for stale dashboards, authentication failures, and missing feeds.
- On-prem control by default, with cloud control treated as an explicit exception.
- A cost model that includes controller refresh, capture hardware, support, and operator training. Use the software vs hardware TCO guide for the baseline comparison.
Describe the dispatch workload before selecting hardware
Start with routine monitoring, planned maintenance and incident coordination as separate operating modes. Ask dispatchers which summaries they need to see together in each mode. Use that discussion to identify the sources that belong on the shared wall.
Create a source register covering connection method, resolution, frame rate, access owner and network dependencies. Separate web dashboards, remote desktops, cameras and captured outputs. Mark sources needed continuously and those opened only when the team investigates an event.
Check the boundary with operational systems
Identify where process-control commands are issued and who owns the underlying applications. The shared display should have a clearly documented role in the operating procedure. Review accounts and permissions with the teams responsible for the source systems.
If the site requires an isolated installation, document every required connection before testing. A locally deployed controller does not remove a dashboard's own dependency on another service. Include source authentication and update delivery in the deployment review.
Design scenes around the operator's questions
Prepare a routine scene that makes the current operating state readable. For incident coordination, identify the additional maps, cameras, work orders or conference sources the team needs. Review whether the most important information remains visible when those sources are added.
Test with real labels and representative source images from the agreed viewing positions. Pay attention to dense process summaries and map annotations. The acceptance record should identify the content used, not only the wall's nominal resolution and display count.
Verify failures across the whole display path
Agree checks for a missing camera, an expired dashboard session, a network interruption and planned controller maintenance. Record what operators observe, who receives the report and how normal presentation is restored. Test those steps on the proposed configuration.
Where hot standby is part of the design, include the source systems, network and output connections in the recovery discussion. Measure the agreed scenario during acceptance. Avoid treating a software feature name as a complete availability commitment for the installation.
Make changes and support part of the handover
Keep the source register, prepared scenes and permission model with the operator instructions. Define how a new dashboard is requested, reviewed and added. Revisit sizing when the simultaneous source workload changes, especially when resolution or frame rate increases.
Compare project offers across software, server hardware, capture, display connections, commissioning and support. Craft Wall publishes a perpetual licence per server and a preconfigured-server starting price. The final configuration follows the actual displays, sources and operating requirements.